Complete Monitoring Stack: Grafana + Prometheus Setup
A step-by-step build of a production monitoring solution with real-time alerting and dashboards that operators actually read.
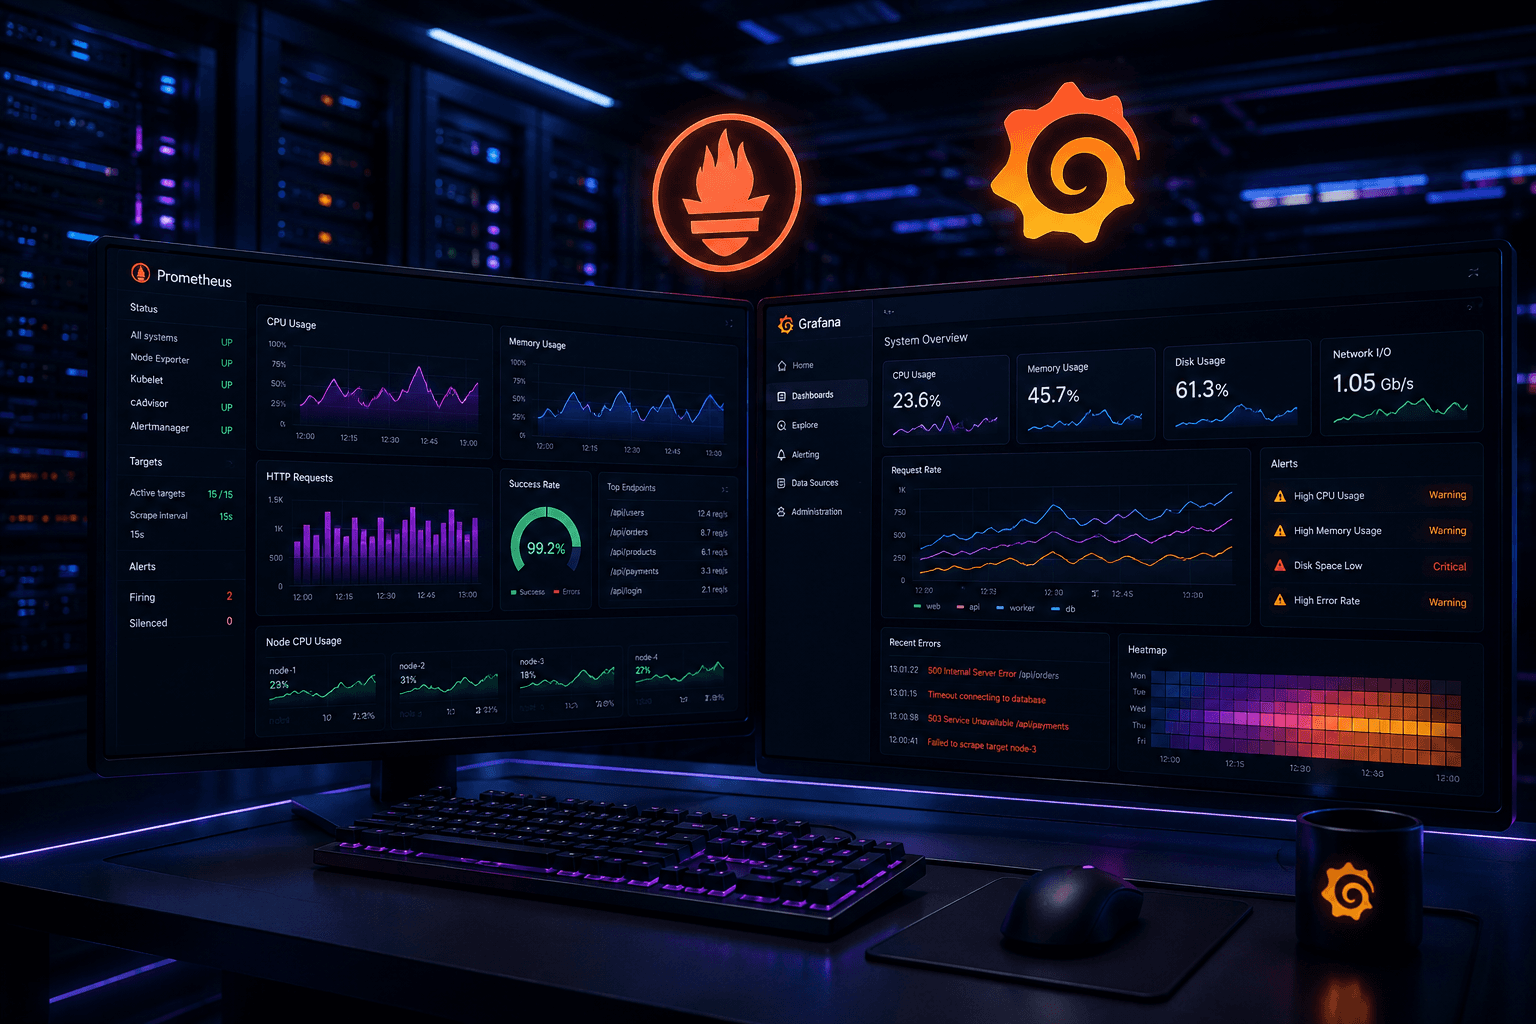
Most monitoring stacks fail for a boring reason: nobody looks at the dashboards, and the alerts are either too noisy to trust or too quiet to matter. Prometheus and Grafana solve the collection and visualisation problem well — the discipline of what to alert on is the part teams skip.
The collection layer
Prometheus scrapes metrics on a pull model, which keeps service instrumentation simple — expose a `/metrics` endpoint and you're done. We run it with a short retention window locally and remote-write to long-term storage (Thanos or Mimir) once a client's history requirements outgrow single-node Prometheus.
Dashboards operators actually open
- One overview dashboard per service: request rate, error rate, latency (the RED method)
- Infrastructure dashboards separated from business-metric dashboards — different audiences
- Every panel links to the relevant logs and traces, so a dashboard is a starting point, not a dead end
- Delete dashboards nobody has opened in 90 days — clutter is why people stop looking
Alerting that people trust
Alert on symptoms your users would notice (error rate, latency, saturation), not on every internal metric that moves. Every page-worthy alert should map to a runbook. If an alert fires and the response is "huh, not sure," that's a signal to fix the alert, not just the incident.
What good looks like
The stacks we're proudest of are the ones where on-call engineers can diagnose most incidents from the first dashboard they open, without needing to SSH into a box. That's the actual goal — Prometheus and Grafana are just the plumbing that gets you there.